
Photo by Jungwoo Hong on Unsplash
UPDATED 2021-03-04:
This article now includes all Kickstarter campaigns that launched in 2020. The significant increase in sample sizes has resulted in minor changes to the outcome of our original analysis. Portions of this article have been rewritten to reflect those changes.
It often takes a lot of data to properly analyze complex issues, and Kickstarter is no exception! But while we wait for the data to slowly pour in, I thought it would be interesting to look at the different categories Kickstarter has to offer, and how they make up the whole.
Kickstarter Categories
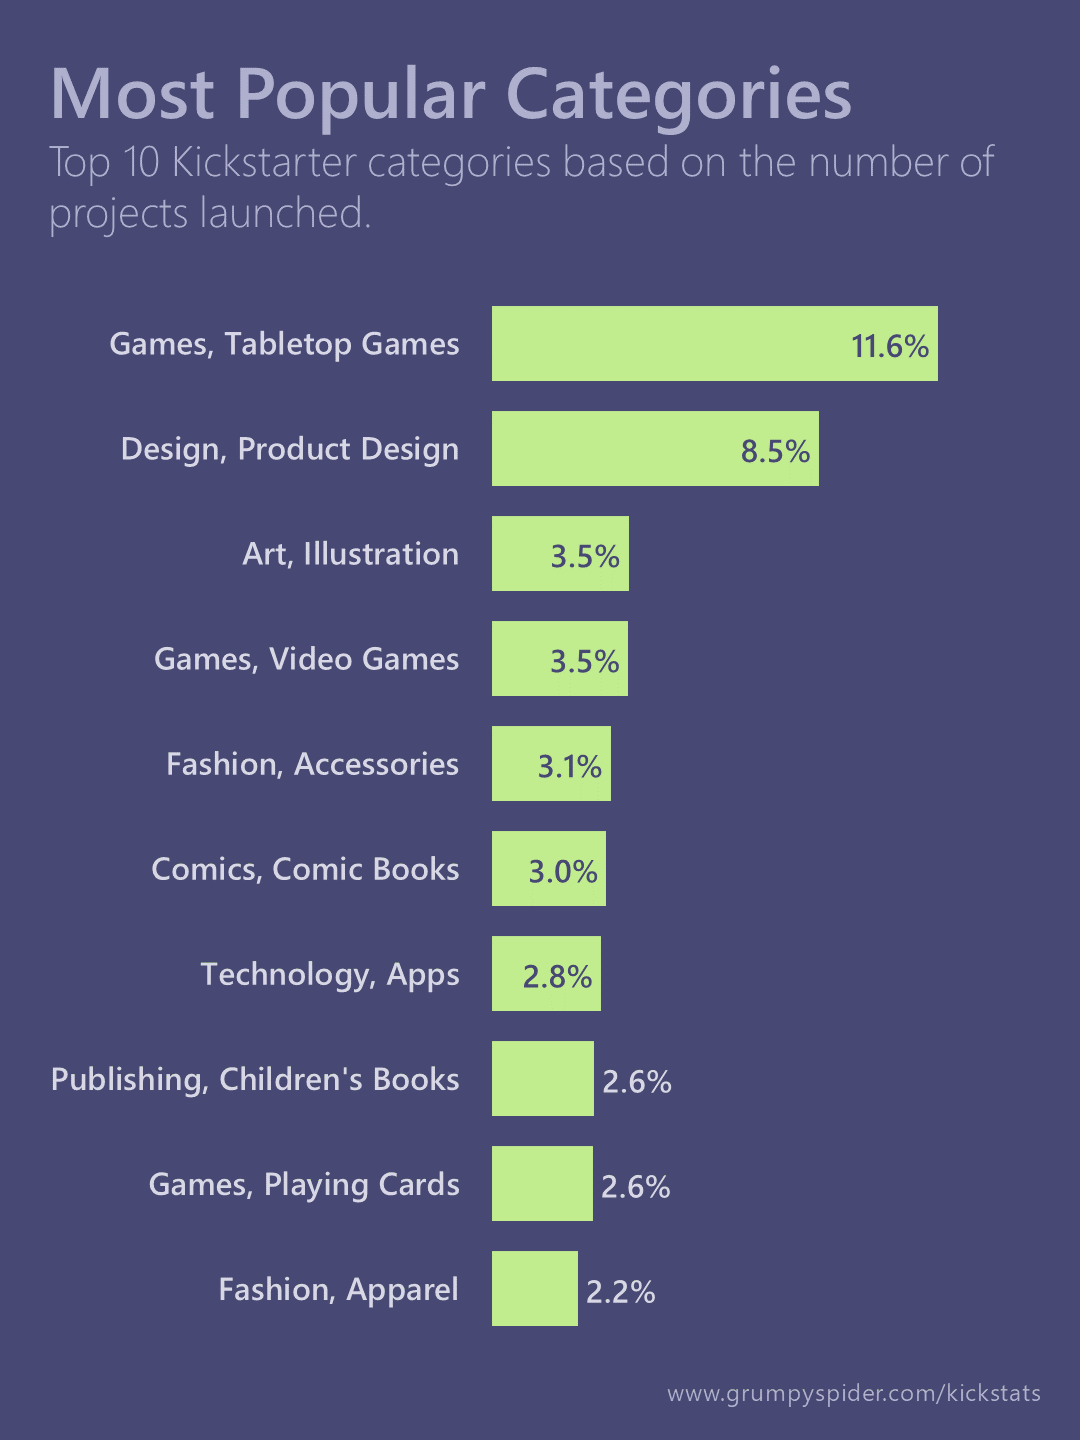
Kickstarter has 15 parent categories for different projects, and those parent categories break down into even more standard categories. Here’s a quick look at the top 10 based on percentage of total projects launched from January through December 2020.
That’s pretty cool, but we’re probably more interested in what categories have the highest success rates:
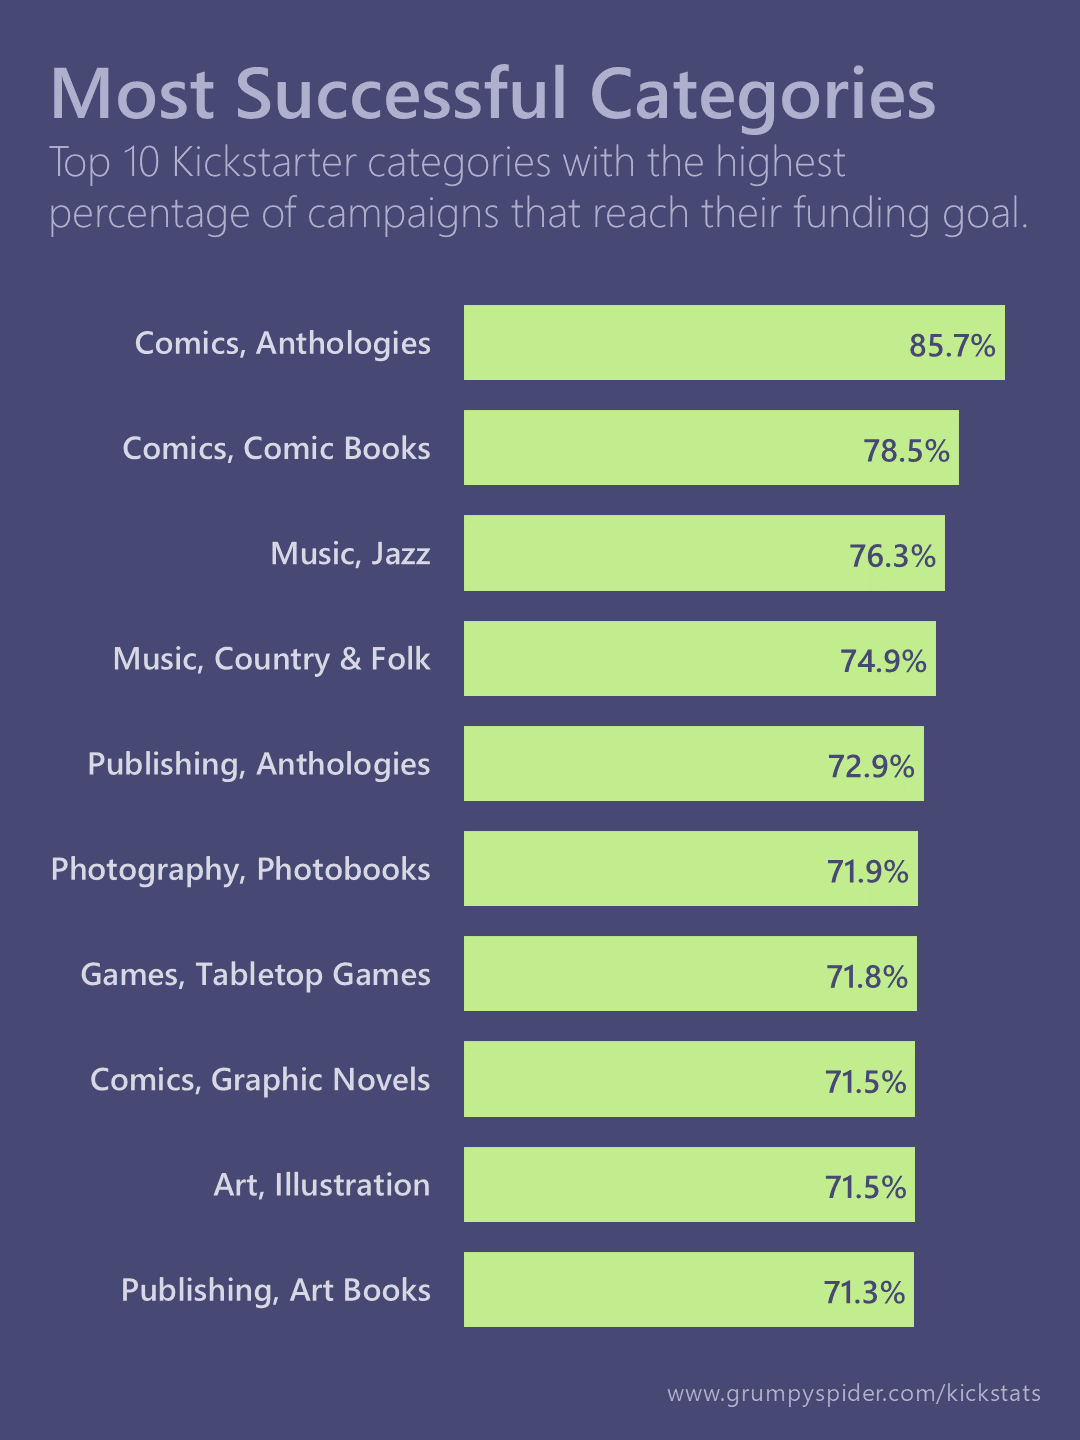
And Anthology Comics takes the gold, at an impressive 85.7% success rate! Board games – the largest category – is still pretty impressive though, at 71.8%, which is good to know as Grumpy Spider works toward launching our first game.
But all this got me curious – what if we looked at popularity of a category vs success? I wonder what that would look like. Thus, I present this hub & spoke chart of Kickstarter’s category hierarchies showing popularity vs success rates!
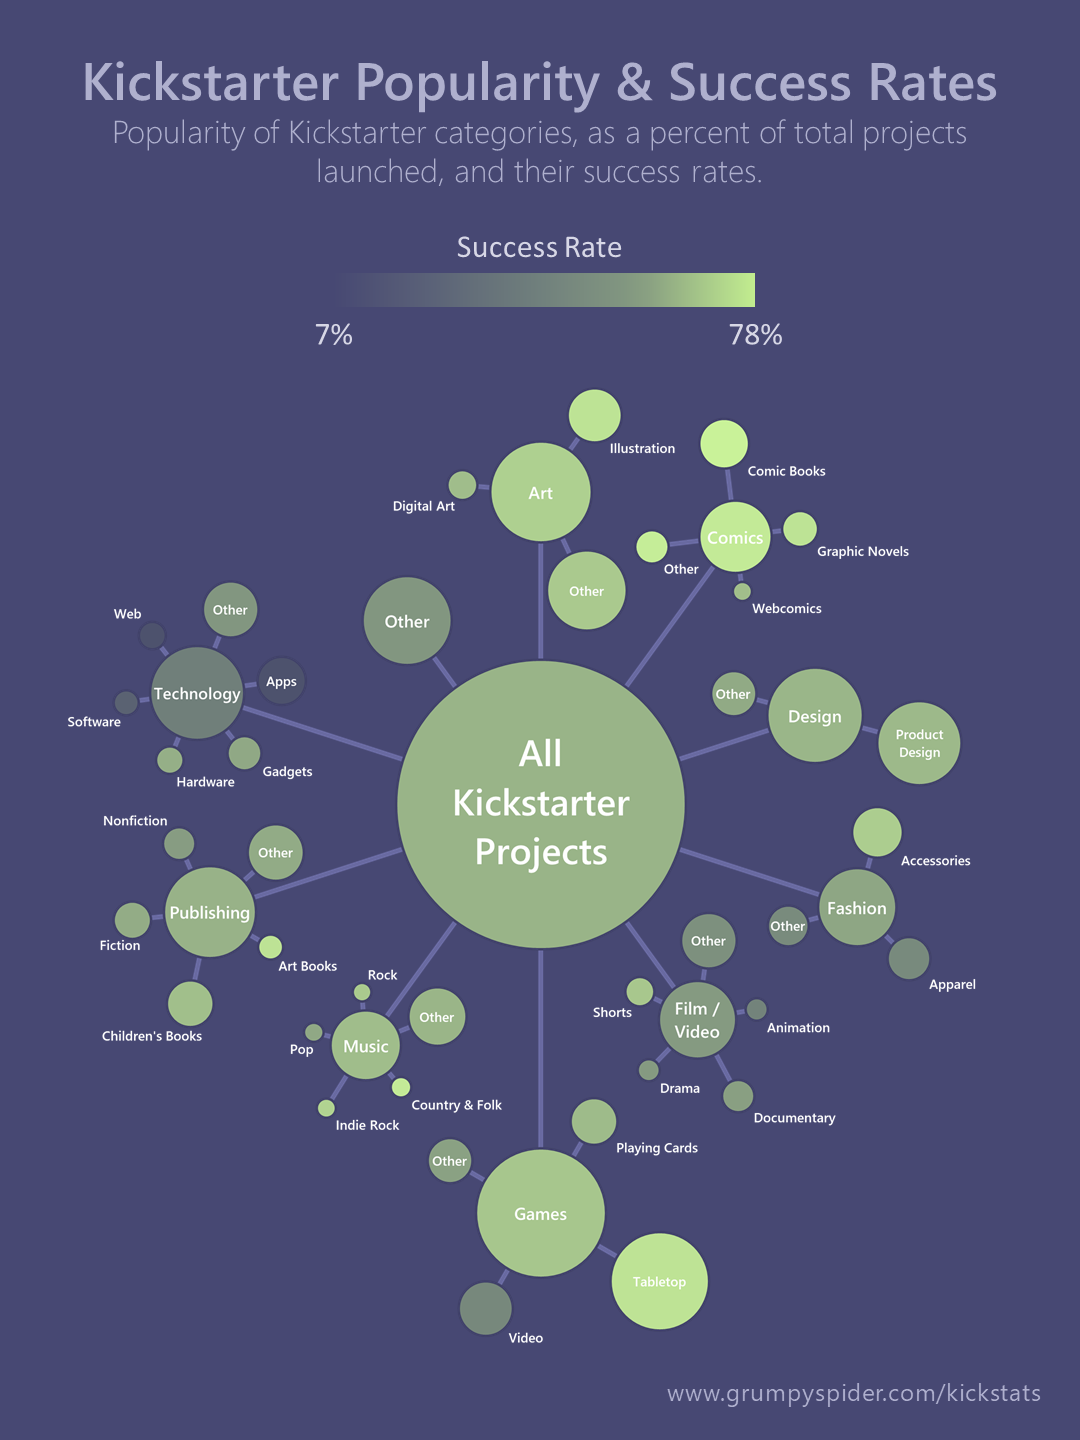
The lines show category hierarchies, the size represents the percentage of total projects that are from that category, and the brightness shows the success rate of that category. Also, in order to get a dedicated node, a category had to make up at least 7% of its parent node. Otherwise, they were lumped into their respective “Other” buckets.
The success rate of Kickstarter overall in 2020 was just over 51%, but individual categories can differ quite a bit from that, obviously. Just look at poor Technology… a relatively popular category, but really low success rates overall. I almost feel bad for Apps, which takes last place, at a measly 7% success rate.
Meanwhile, Comics seems to do the best overall, with several of their categories doing unusually well.
Conclusion
I can’t say that I have many conclusions to draw – I just thought it was interesting. But there is one important thing to keep in mind as we move forward in this series…
Be careful not to take general information and assume it always applies to specific cases. For instance, Tabletop Games as a category has a 72% success rate. Does that mean that your next tabletop campaign has a 72% chance of success? Absolutely not! Individual cases are much too complex for such simple predictions – that’s why we need lots of data, and solid methods of statistical analysis to help us find what really helps or hurts the average campaign. And that’s just what this series is all about!
Leave a Reply