Image by Claudio Schwarz on Unsplash
Introduction
There are three questions that probably every Kickstarter creator has asked themselves. The first is “What day of the week should I launch?”. The second is “What time of day should I launch?”. The third is what I’d like to cover in this post: “What month should I launch?”
It’s a difficult question to answer for a number of reasons, and not just because of limitations in the data (which we’ll cover). I think the main reason it’s difficult is that each Kickstarter campaign is so unique. The preparation required can differ so much from project to project.
Conventional wisdom rightly points out the best answer to this question, which is “Launch whenever you’re ready.” This hearkens back to the biggest factor that affects your chances of success. There are no substitutes for proper preparation. Launching before you’re ready just so you don’t miss out on “the perfect month” is like trading a dollar for a dime – it’s just never a good idea.
But let’s say you know what it will take to prepare and now you’re just trying to plan things out. Should you plan to launch in August, or would it be worth it to wait a few weeks and launch in September? That’s what we’ll attempt to answer here.
Before We Start
I mentioned that this is a difficult question to answer because each campaign has unique preparation needs, but it’s also difficult because of some limitations in the data. As weird as it may seem, figuring out what month is the best month to launch might just be the most difficult question we’ve tackled in the entire Kickstats series! So here are some things we need to keep in mind as we analyze the data.
Data Timeframe
I’ve only been collecting Kickstarter data since January of 2020. Even though that means I have over 50,000 campaigns, they only cover about 18 months. That means that – right now – July through December only show up for 1 year. A lot of lurking variables can affect a month if it’s only coming from a single year. I’m talking about things like the economy of that year, the number of weekends a given month has, or where holidays land. Even the weather could be a factor if a particular month is much nicer or much gloomier than usual. And that’s not even mentioning COVID, which is obviously a huge factor.
Most likely, a lot of these factors will end up balancing each other out, more or less, but since we only have 18 months, we just don’t know.
Amount of Data
You might think that 50,000+ campaigns would be more than enough to analyze in any way you wanted, but as it turns out, subsets start getting pretty small once you start slicing and dicing on multiple factors.
For instance, during my analysis, I saw that the day of the week, the percentage of first-time creators, the beginning vs end of the month, the funding goal, and certain Kickstarter categories all were potential confounding variables. I’d love to account for all of those, but do you know how many first-time tabletop creators launched a campaign with a goal below the median on the last Monday in January? Five. That’s right – five. That’s just not a big enough number to analyze with confidence.
So, what that means is that I’ve had to choose only the variables that I think might have the biggest effect. From there, we’ll just have to keep these caveats in mind as we attempt to interpret the results.
Analysis
Now that we’re aware of the caveats and are making sure to keep them in mind, let’s start the analysis! As usual, let’s graph the raw numbers.
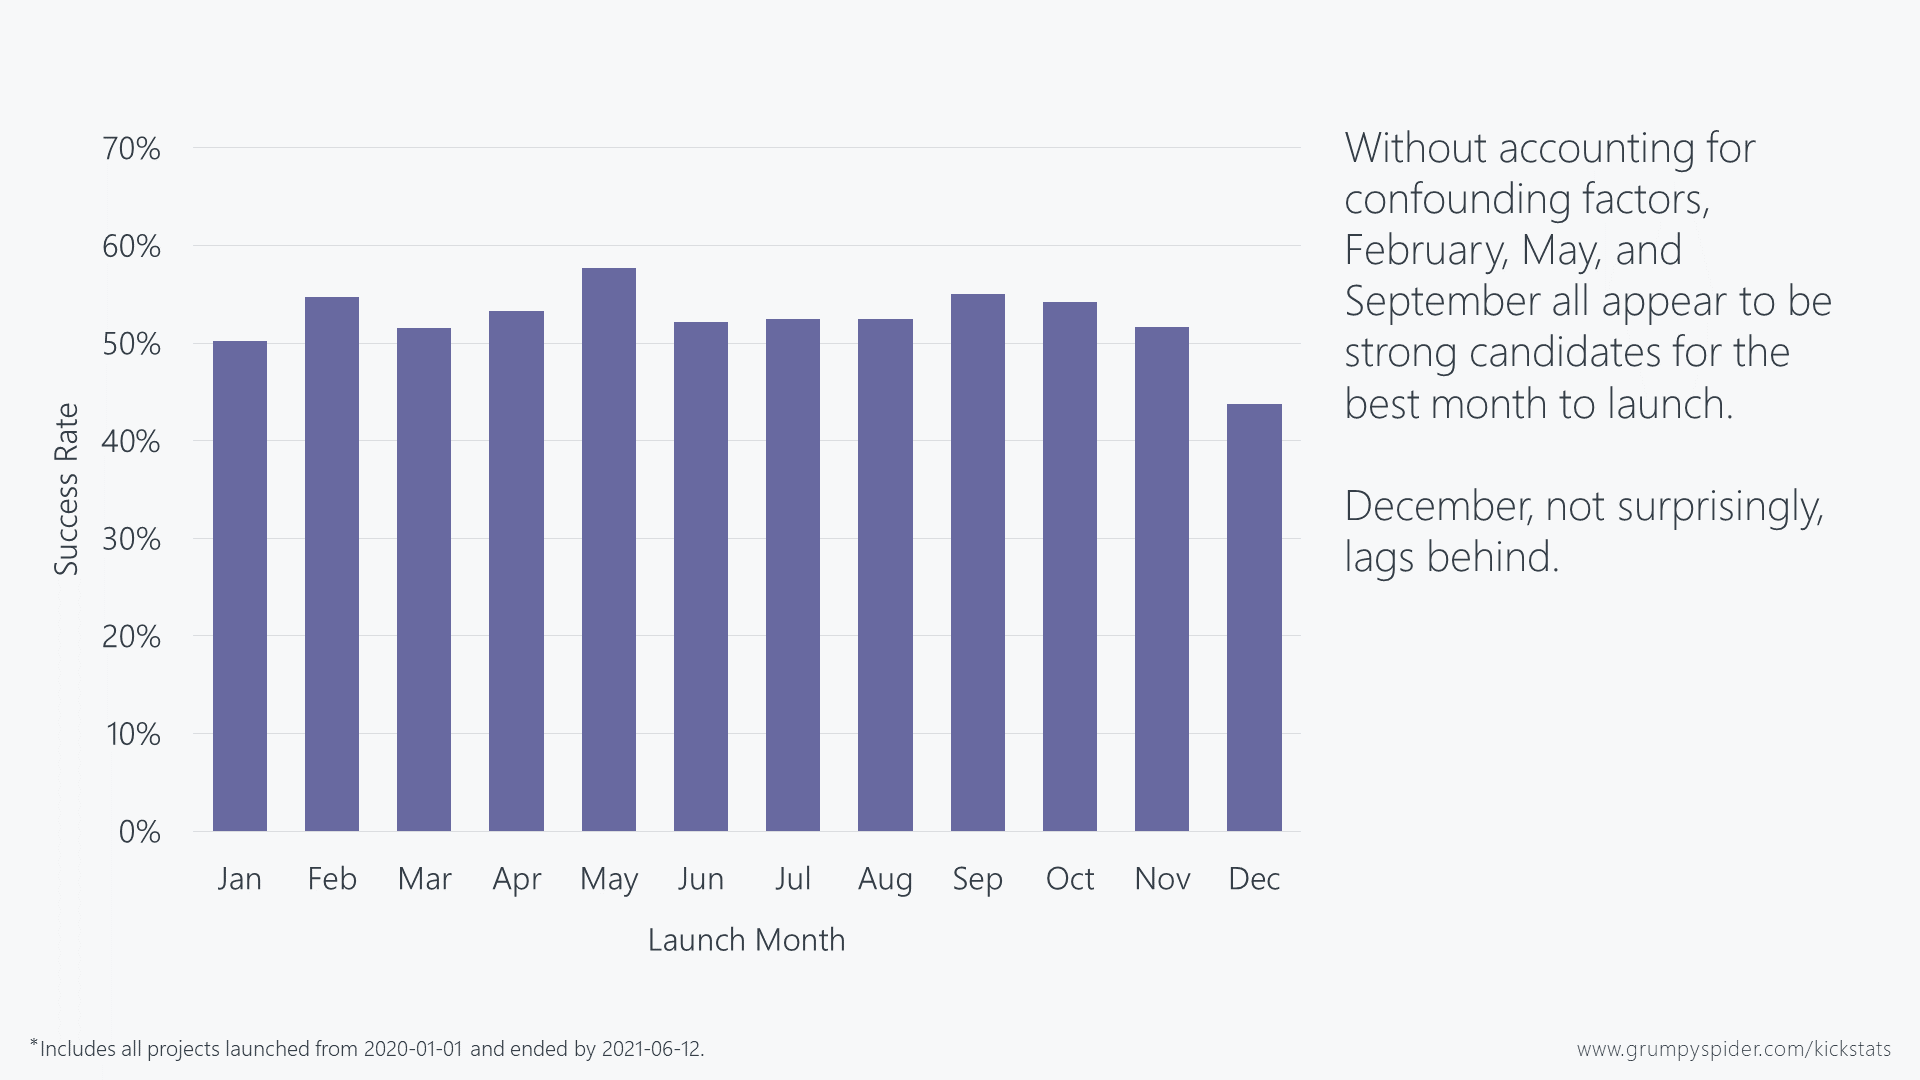
So it looks like most months are roughly on par with each other. February, May, and September do appear to be just a bit better than the others, but not by much. December, on the other, is quite a bit lower than the other months. I don’t think that comes as much of a surprise, but I do wonder how much of this is because of lurking variables.
Day of the week
We’ve already shown that what day of the week you launch can make a difference. So, it seems obvious that that could be affecting things here. I mean, if Sunday is the worst day to launch, and December has more Sundays than any other month, that could certainly make December look worse than it really is, right? Now, the number of Sundays a month has changes from year to year, but remember, we only have a year and a half’s worth of months right now, so we’ll need to adjust for that.
First-time creators
Since it’s well-known that first-time creators have lower success rates, we need to see if they seem to congregate around any particular time of the year. Turns out, they do.
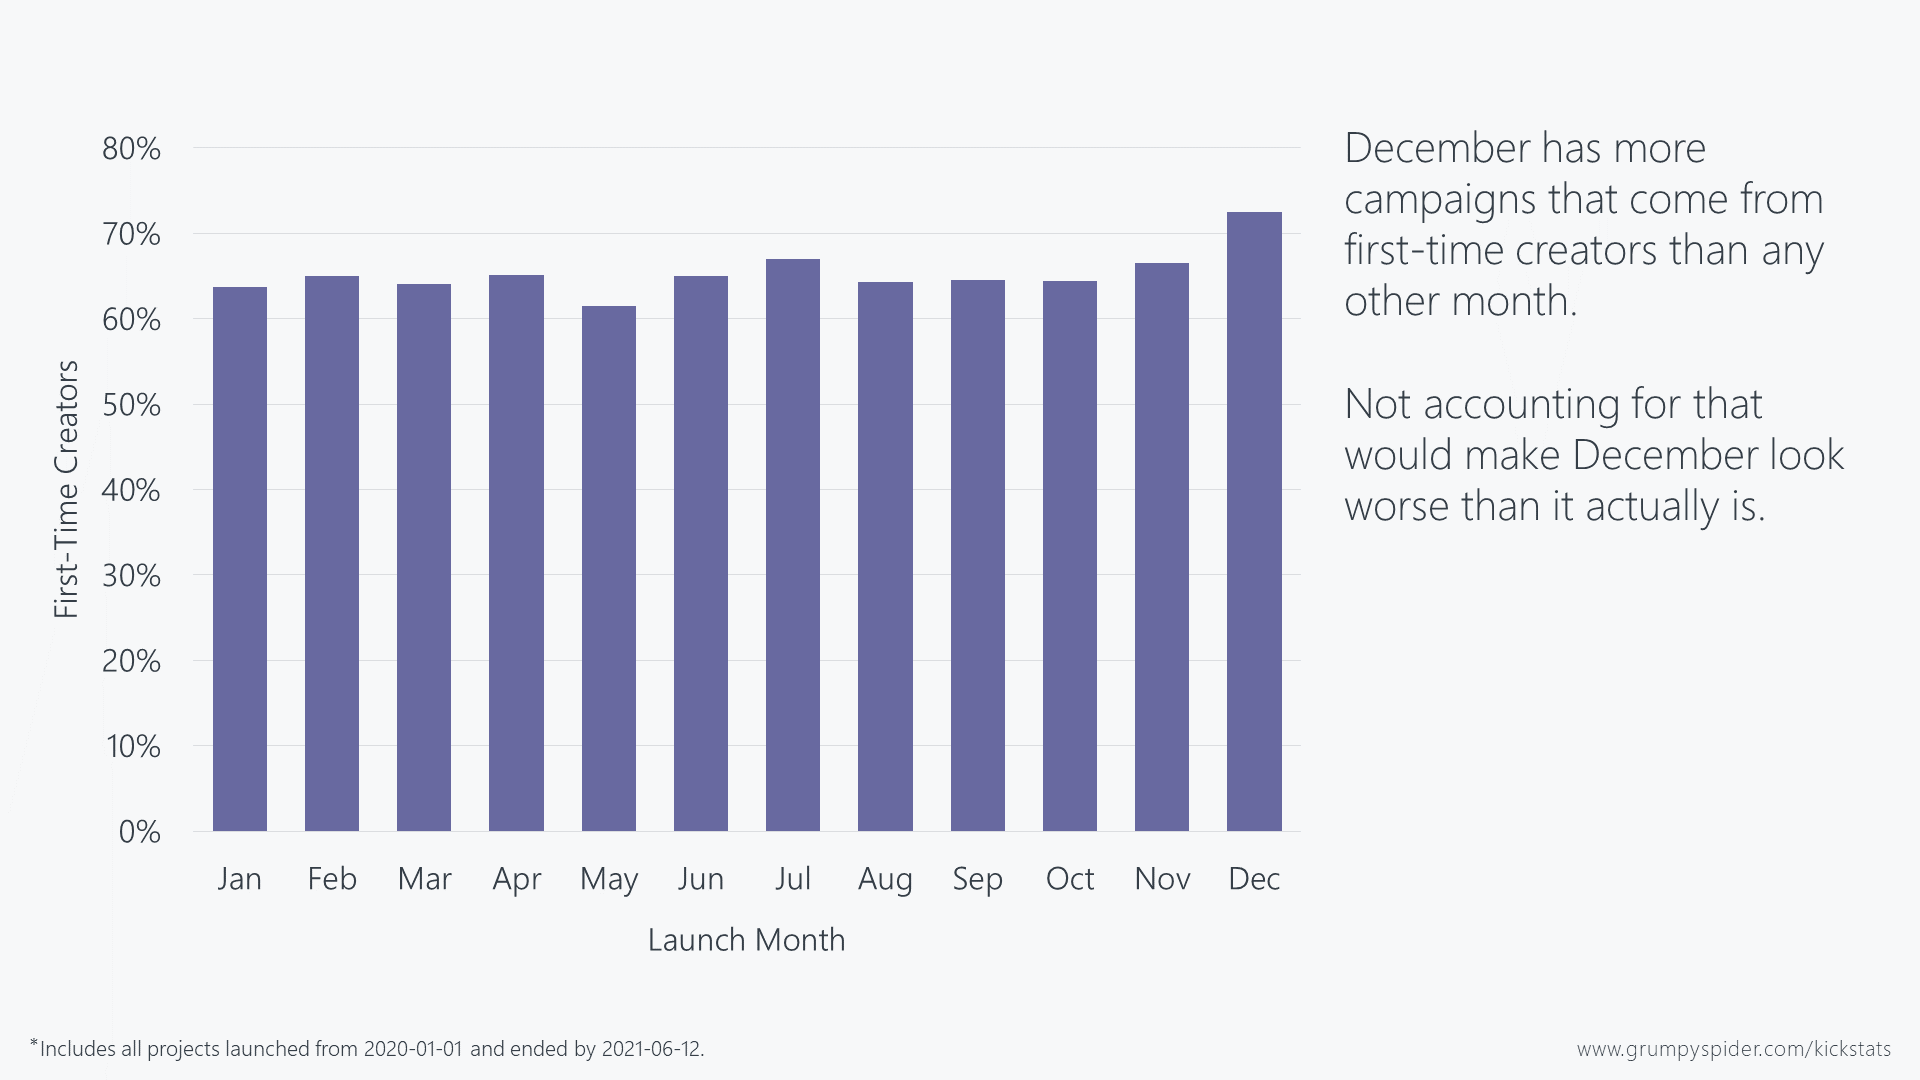
Most months have roughly the same proportion of first-time creators as any other. December, however, has substantially more.
It’s hard to say for sure why, but I’d guess it’s because first-time creators are less likely than their veteran counterparts to come across the conventional advice to avoid December. So, comparatively, it has more.
Tabletop game campaigns
Tabletop games are also another common confounding factor that we’ve recently been trying to account for, since it’s the largest and among the most successful categories on Kickstarter. It could easily influence the outcome if tabletop campaigns aren’t evenly distributed among all months.
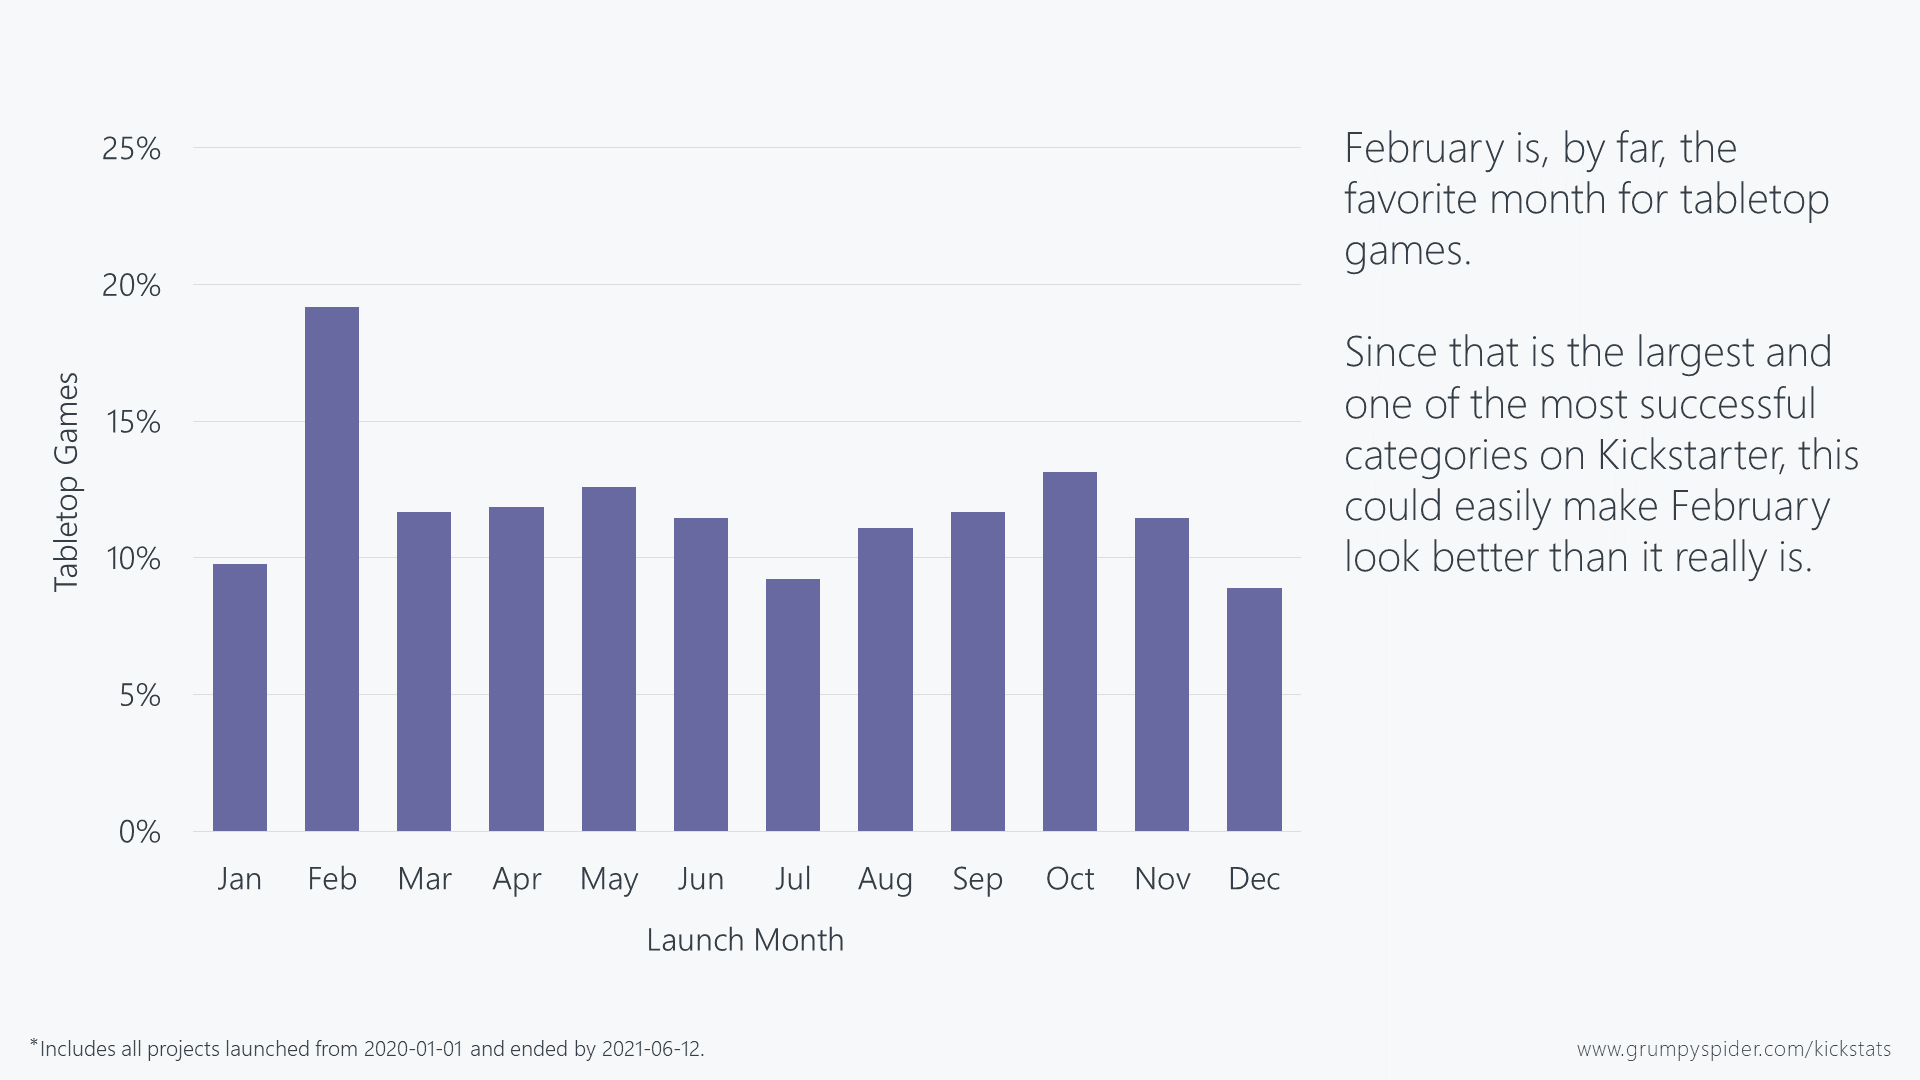
Now here’s something that took me by surprise! For some reason, tabletop games seem to love February. Nearly one-fifth of all campaigns that launch in February are tabletop games; more than twice that of July and December! We’ll definitely need to adjust things there as well.
Other factors
Like I mentioned earlier, there are a number of other factors that make strong candidates for confounding variables, but we just don’t have the data we need to include everything. What I’ve attempted to do with the three that I chose was account for what seemed to be the biggest factors. Until we have more data, that’s all we can do.
Results
Before we get into interpretation, I want you to notice the range of the vertical axis. Normally, I like to start that axis at zero, but the results are so closely packed that I needed to adjust it so we could see the detail. So keep in mind that what seems like a huge difference is really only a few percentage points at most.
But without further ado, here are the tentative results for best month to launch on Kickstarter!
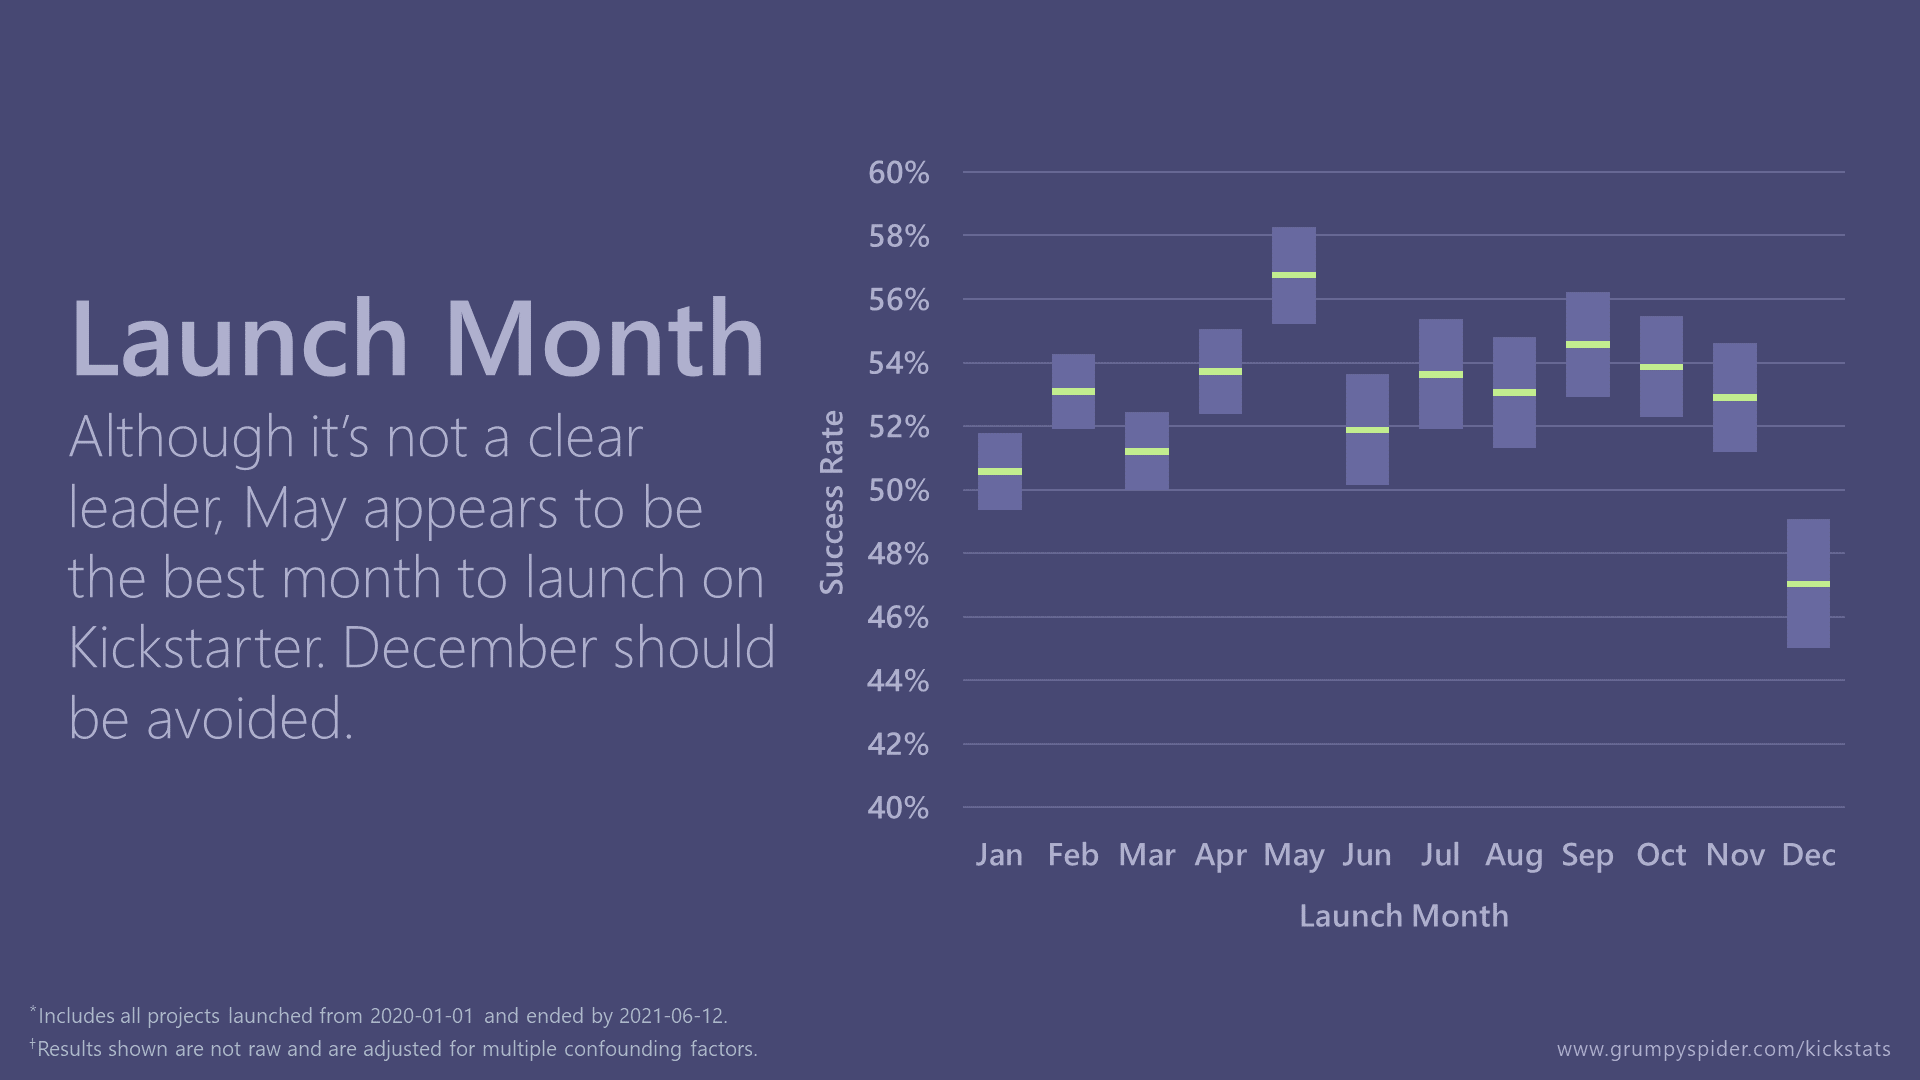
Well, no earth-shattering changes, but there are a few things we can glean.
First, it looks like February’s spot as 2nd place was largely due to tabletop games liking that month so much. Once you account for that, it falls right to the middle of the pack.
Second, notice the light shaded region for each month. That represents the confidence we have in a given month’s value. The only way we can say with confidence that one month is better/worse than another is if their shaded regions do not overlap at all. As you can see, May has the best success rate, but its shaded region overlaps with September, July, and October. So, we can’t say for sure that May actually is the best. Likewise, we see that June is one of the lower months, but its confidence interval overlaps almost every other month, so we really don’t know where it lands.
One thing we can say with confidence, though, is that December does indeed seem to be a bad month for launching Kickstarter campaigns. Again, there are quite a few factors that we can’t account for yet, so this is all still tentative, but December seems far enough down that I’m fairly confident in the results.
What do you think?
Did these results surprise you? Is there anything you think I should account for as we get more data? Let me know in the comments!
Leave a Reply