Kickstats: Backing Other Projects

Photo by Nicole Baster on Unsplash

UPDATED 2021-03-22:

This article now includes all Kickstarter campaigns that launched in 2020. The significant increase in sample sizes has resulted in minor changes to the outcome of our original analysis. Portions of this article have been rewritten to reflect those changes.

Common sense tells us that backing other projects on Kickstarter will help get your own campaign funded. It’s true that the people you back might return the favor, but that’s not the important part. What’s really important is that it shows others you’re not focused entirely on yourself. I know that I, personally, most enjoy helping those who help others. I imagine I’m not the only one who feels that way either. On top of that, it also gives you valuable experience with what it’s like to be a backer, which I believe many people consider before deciding on whether or not to back a campaign on Kickstarter.

Because of all that, I’m certain that backing other Kickstarter projects does affect things, but the question is “by how much?”. Does backing other projects affect a campaign’s success enough to make a tangible difference?

Hypothesis

My personal guess is that backing other projects is one of the best “tweaks” you can make to a Kickstarter campaign. I expect it to be even greater than what day of the week you launch, or even the time of year you launch. I also feel like the effect of backing other projects starts to level off after about four campaigns or so. Don’t ask me why I think that last part, though – it’s just a hunch!

Analysis

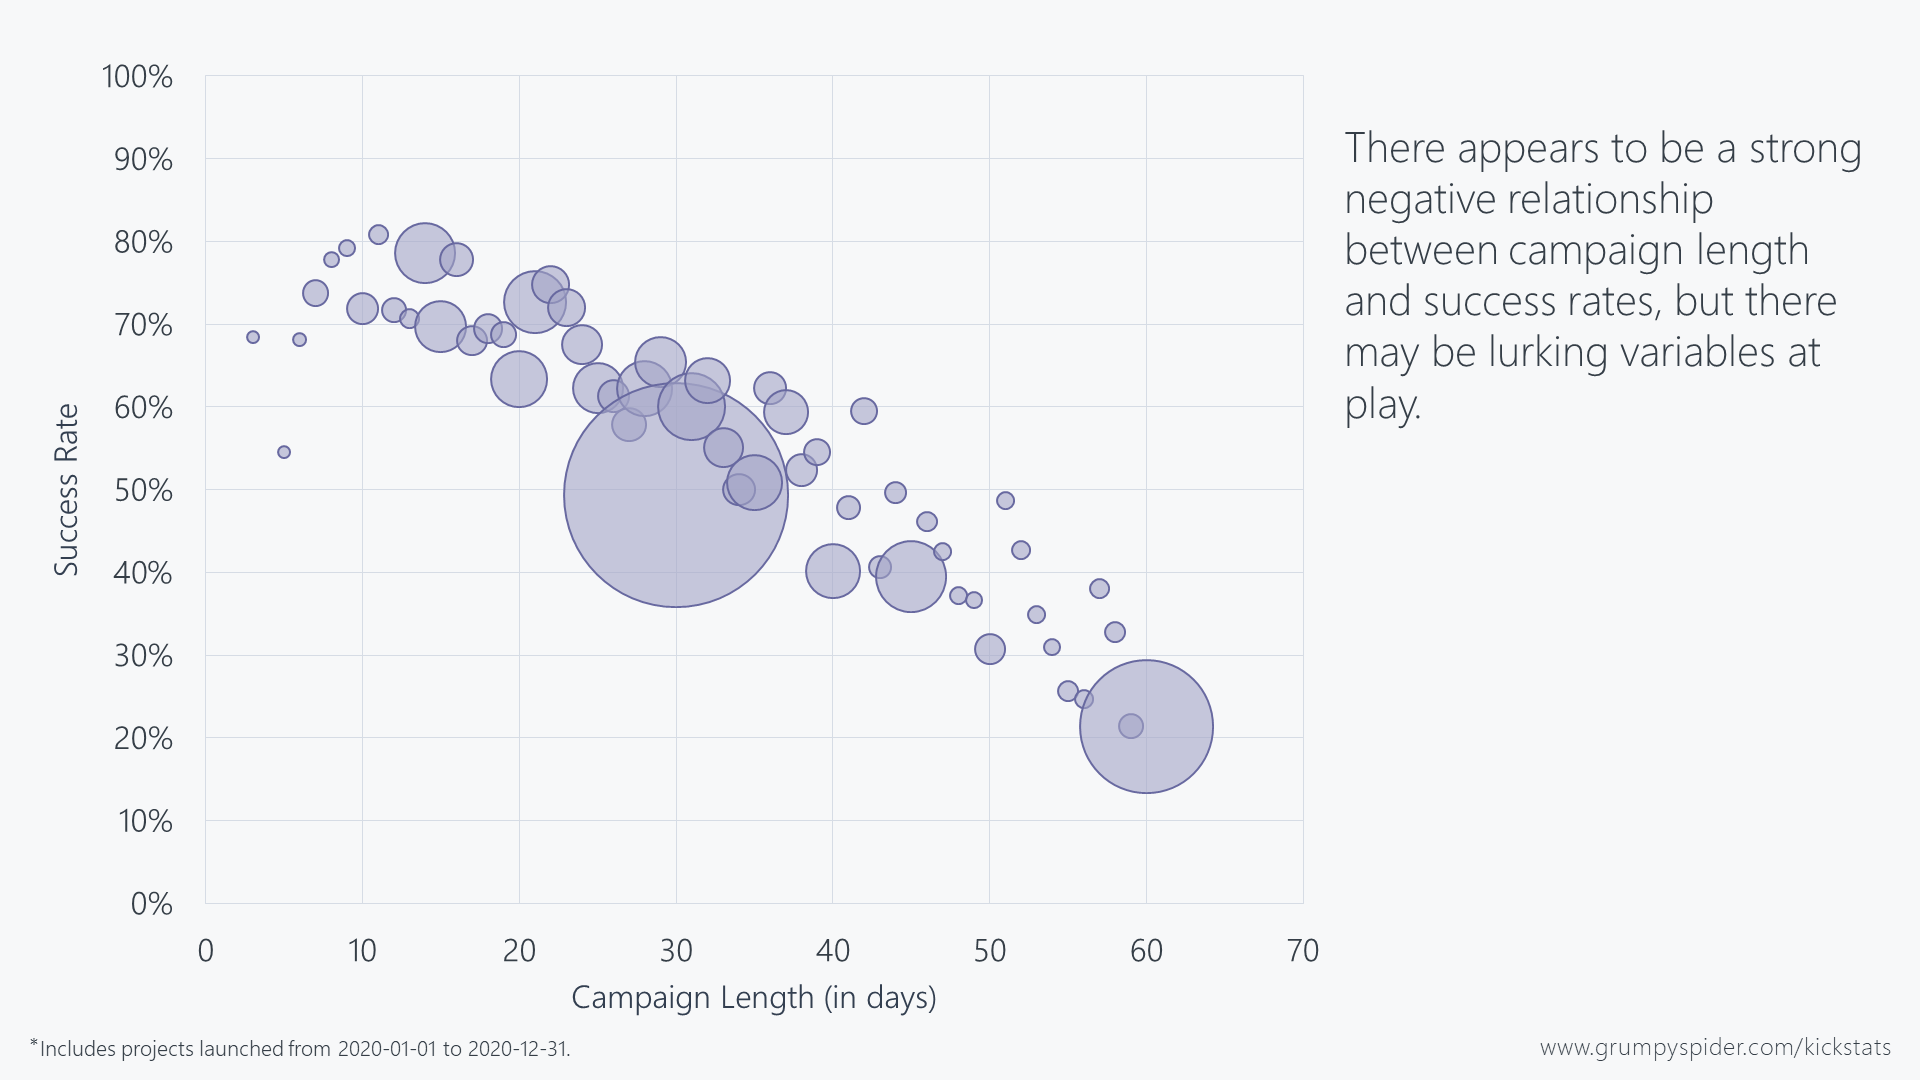
As usual, let’s start with a simple trend line showing campaign success rates versus the number of projects the creator has backed at the time their respective campaigns launched. Each point here represents multiple campaigns that all had the same number of projects backed.

Graph showing Kickstarter success rates versus number of projects backed by the creator.

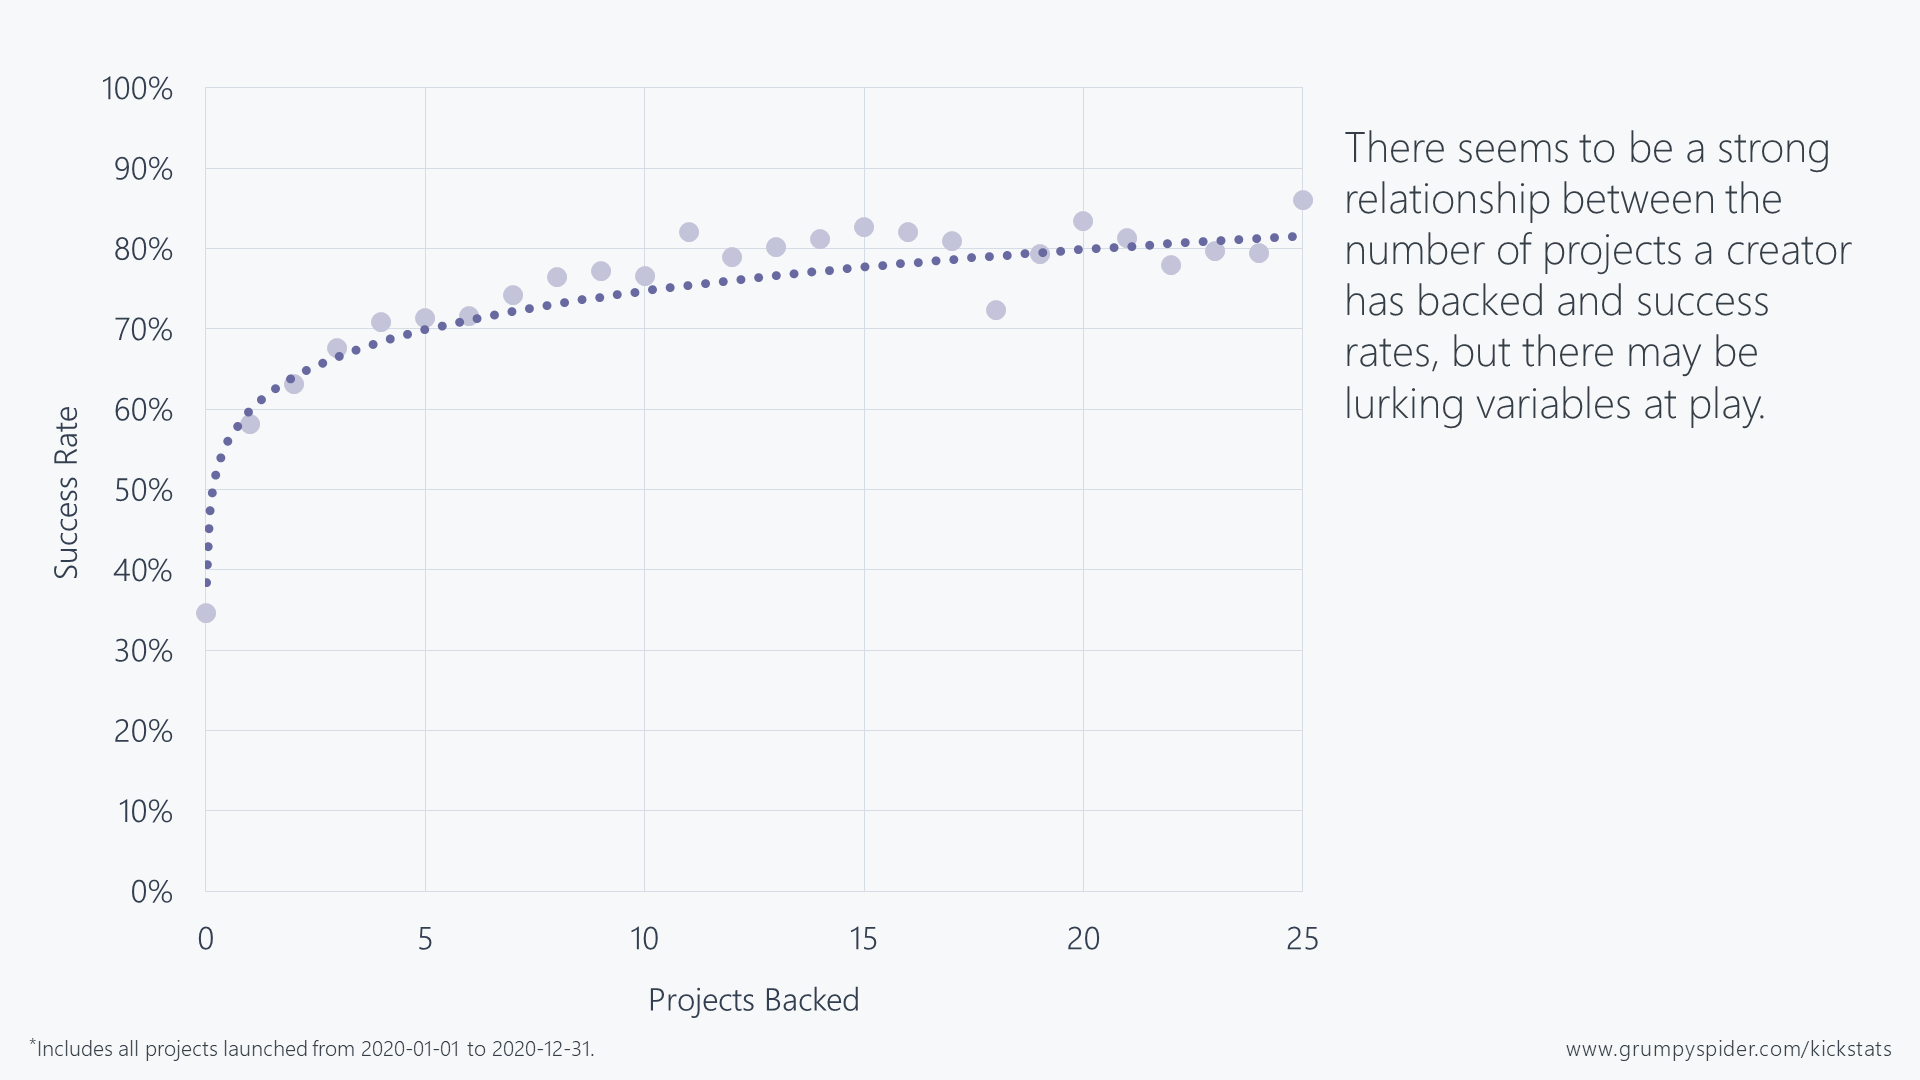
As expected, this is a fairly strong correlation. Notice, however, that I didn’t say causation. Before we can start suggesting causation, we need to look at a couple of possible lurking variables.

First-time Creators

If I were a betting man, I’d be willing to wager quite a bit that there’s a strong link between first-time creators and number of projects backed. If nothing else, veteran creators have probably been using Kickstarter longer and, as a side-effect, have seen more projects that they’ve felt are worth backing.

I also think there are far too many first-time creators out there who know very little about Kickstarter other than “Hey, free money!”. Creators like that typically have very little interest in finding a community to support.

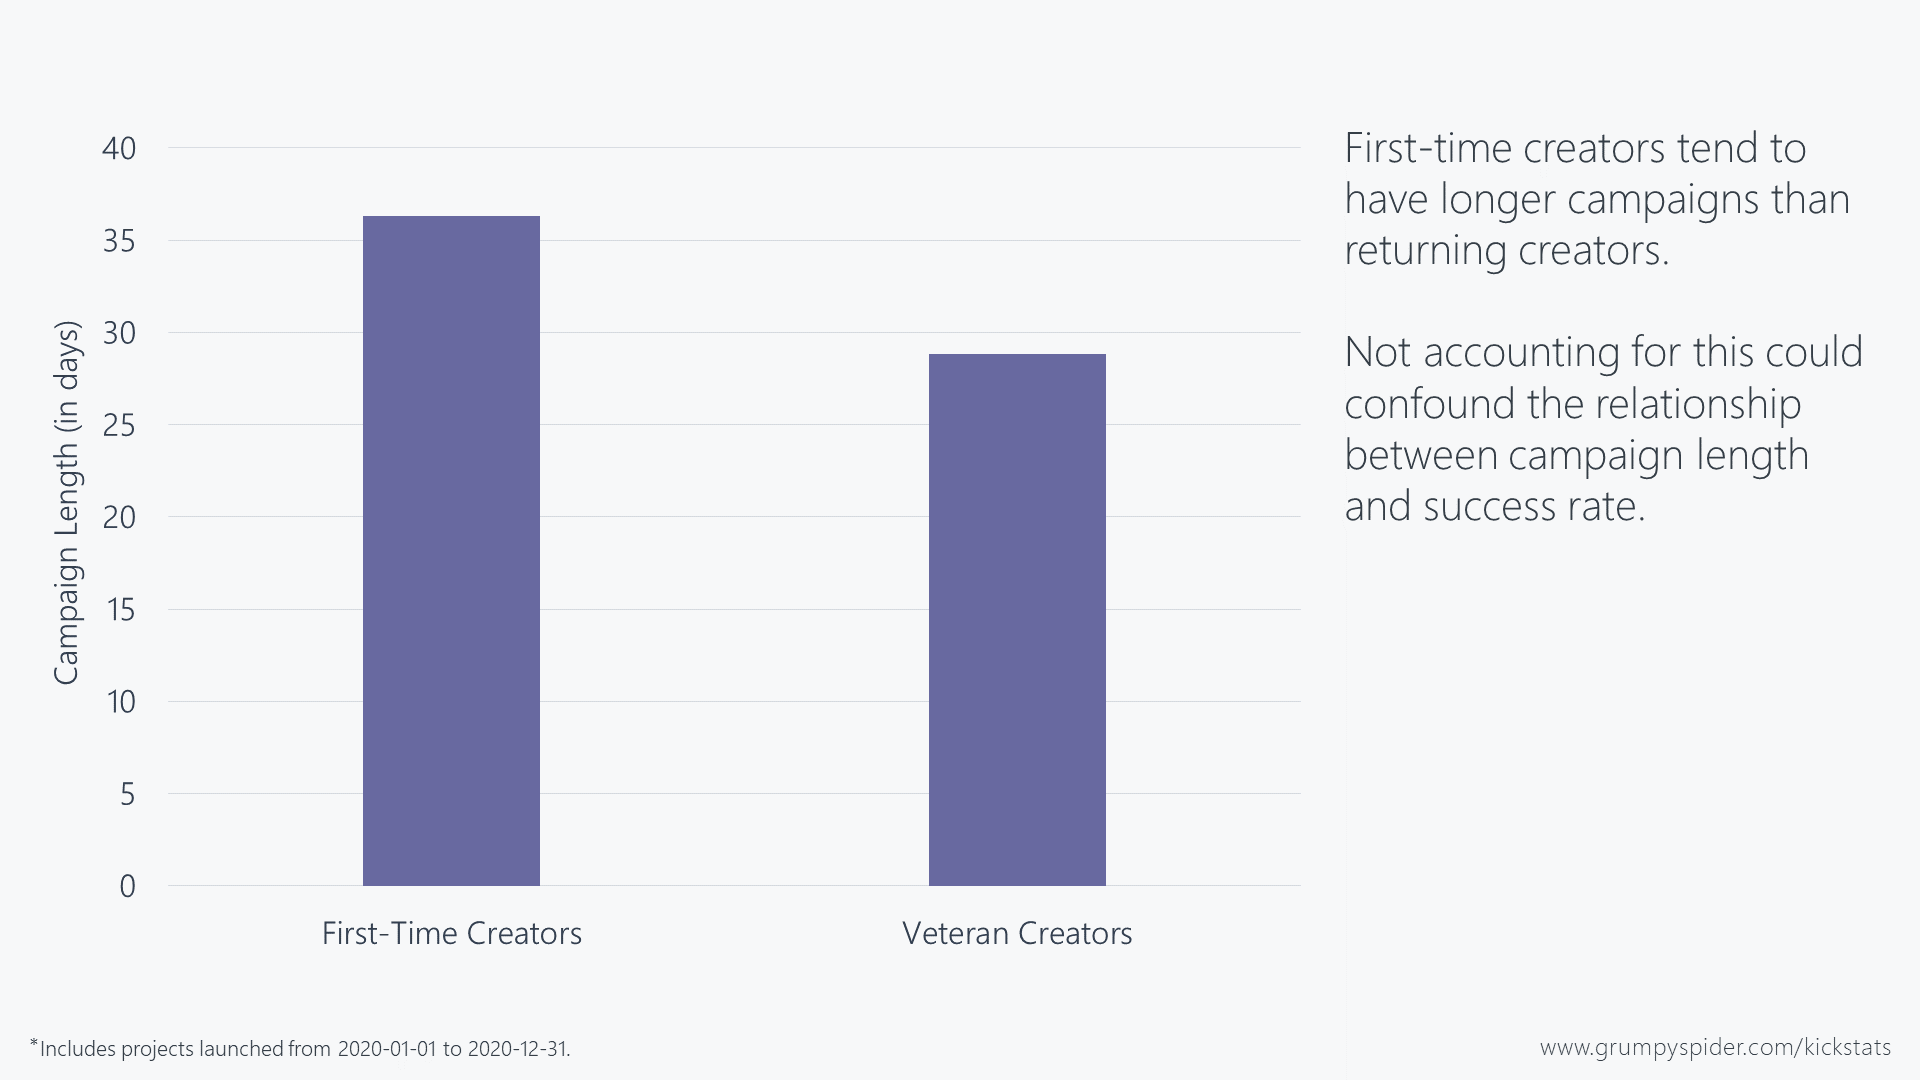
But enough of my reasoning, let’s graph it to see if I’m right.

Chart showing that first-time Kickstarter creators back far fewer projects on average than veteran Kickstarter creators.

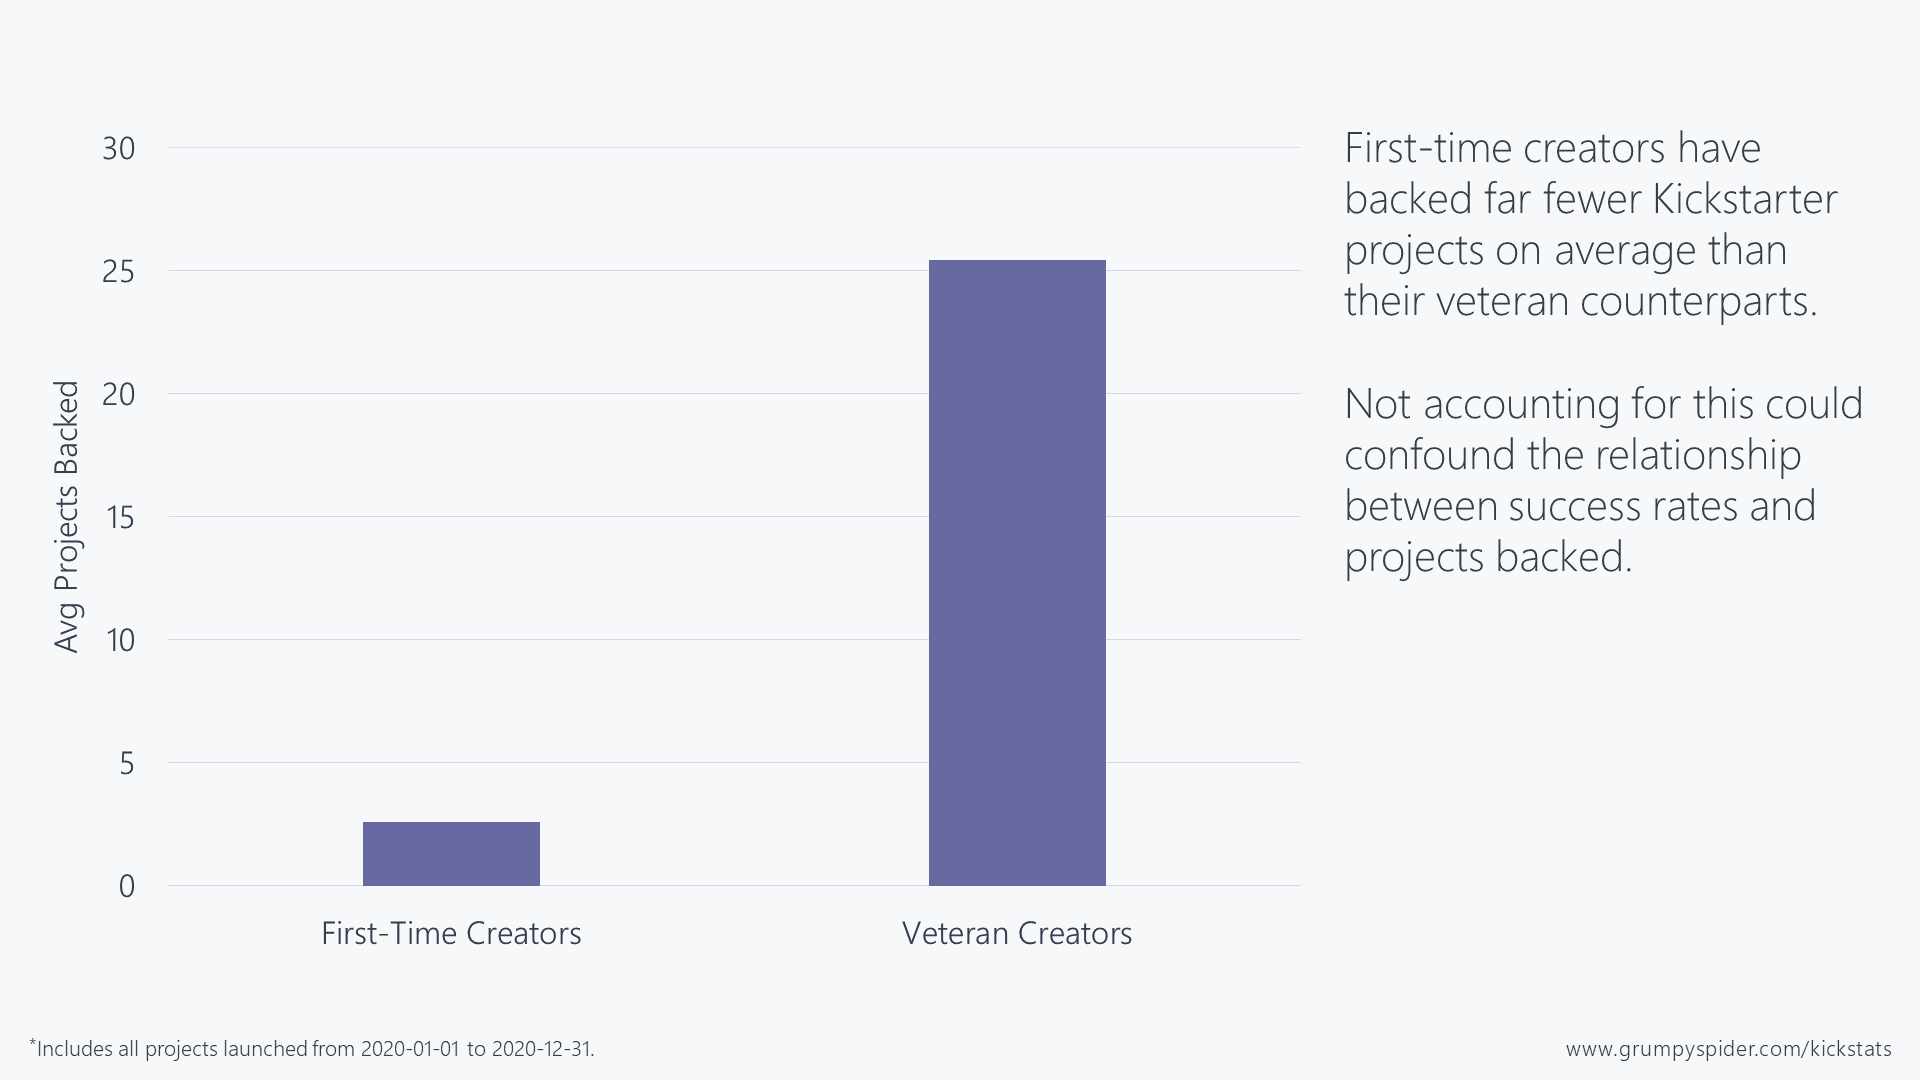
Holy moly! That might be the most right I’ve ever been in my entire life! First-time Kickstarter creators, on average, back 2.6 projects by the time they launch their first campaign. Veteran creators, on the other hand, back a whopping 25.4 projects by the time they launch their respective campaigns!

That’s definitely a strong correlation, and since we’ve already shown that being a first-time creator strongly affects your chance of success, we now have some evidence that it’s also confounding the effects of projects backed. So, we’ll need to adjust for that.

Results

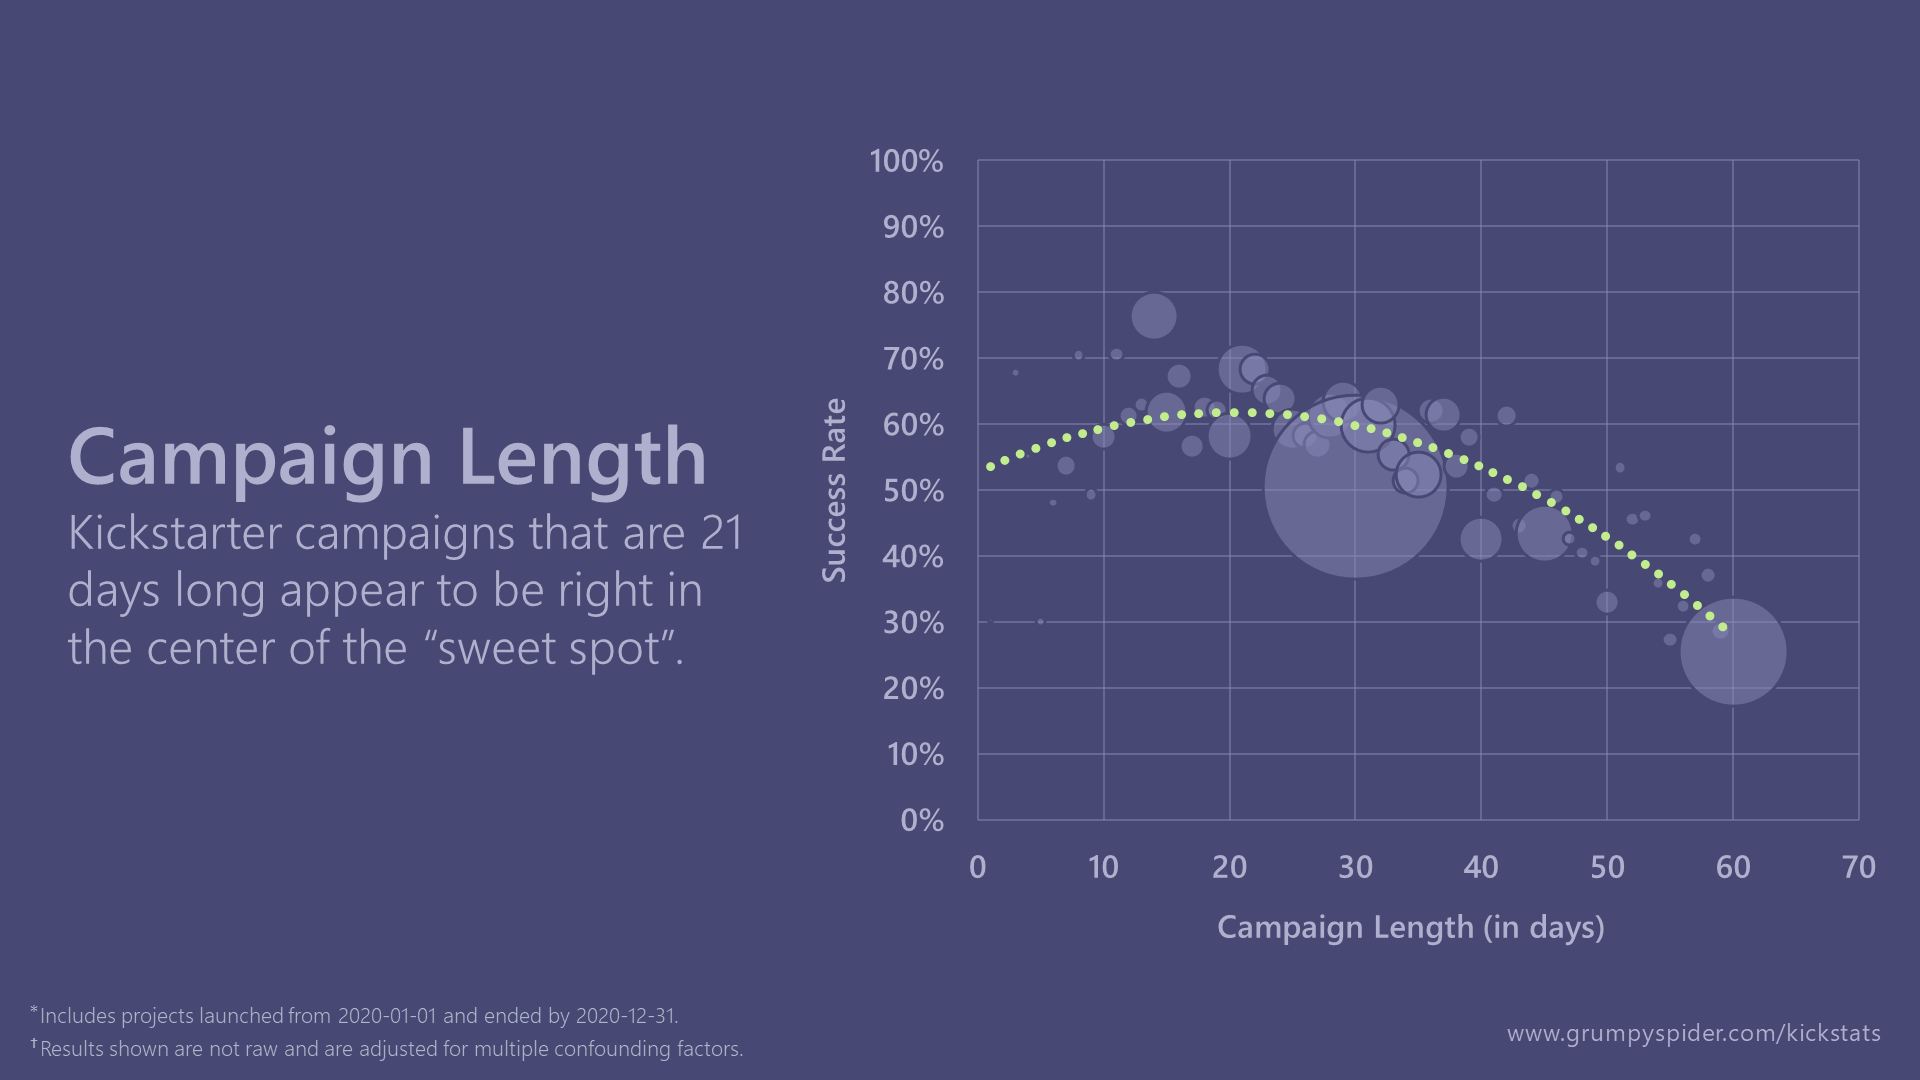
All of this adjusting stuff can get really boring really fast, so I’ll just skip the explanation and jump to the results! How does the number of projects you back affect your chance of success? The below chart shows you just that!

Graph showing the final relationship between Kickstarter success rates and projects backed.

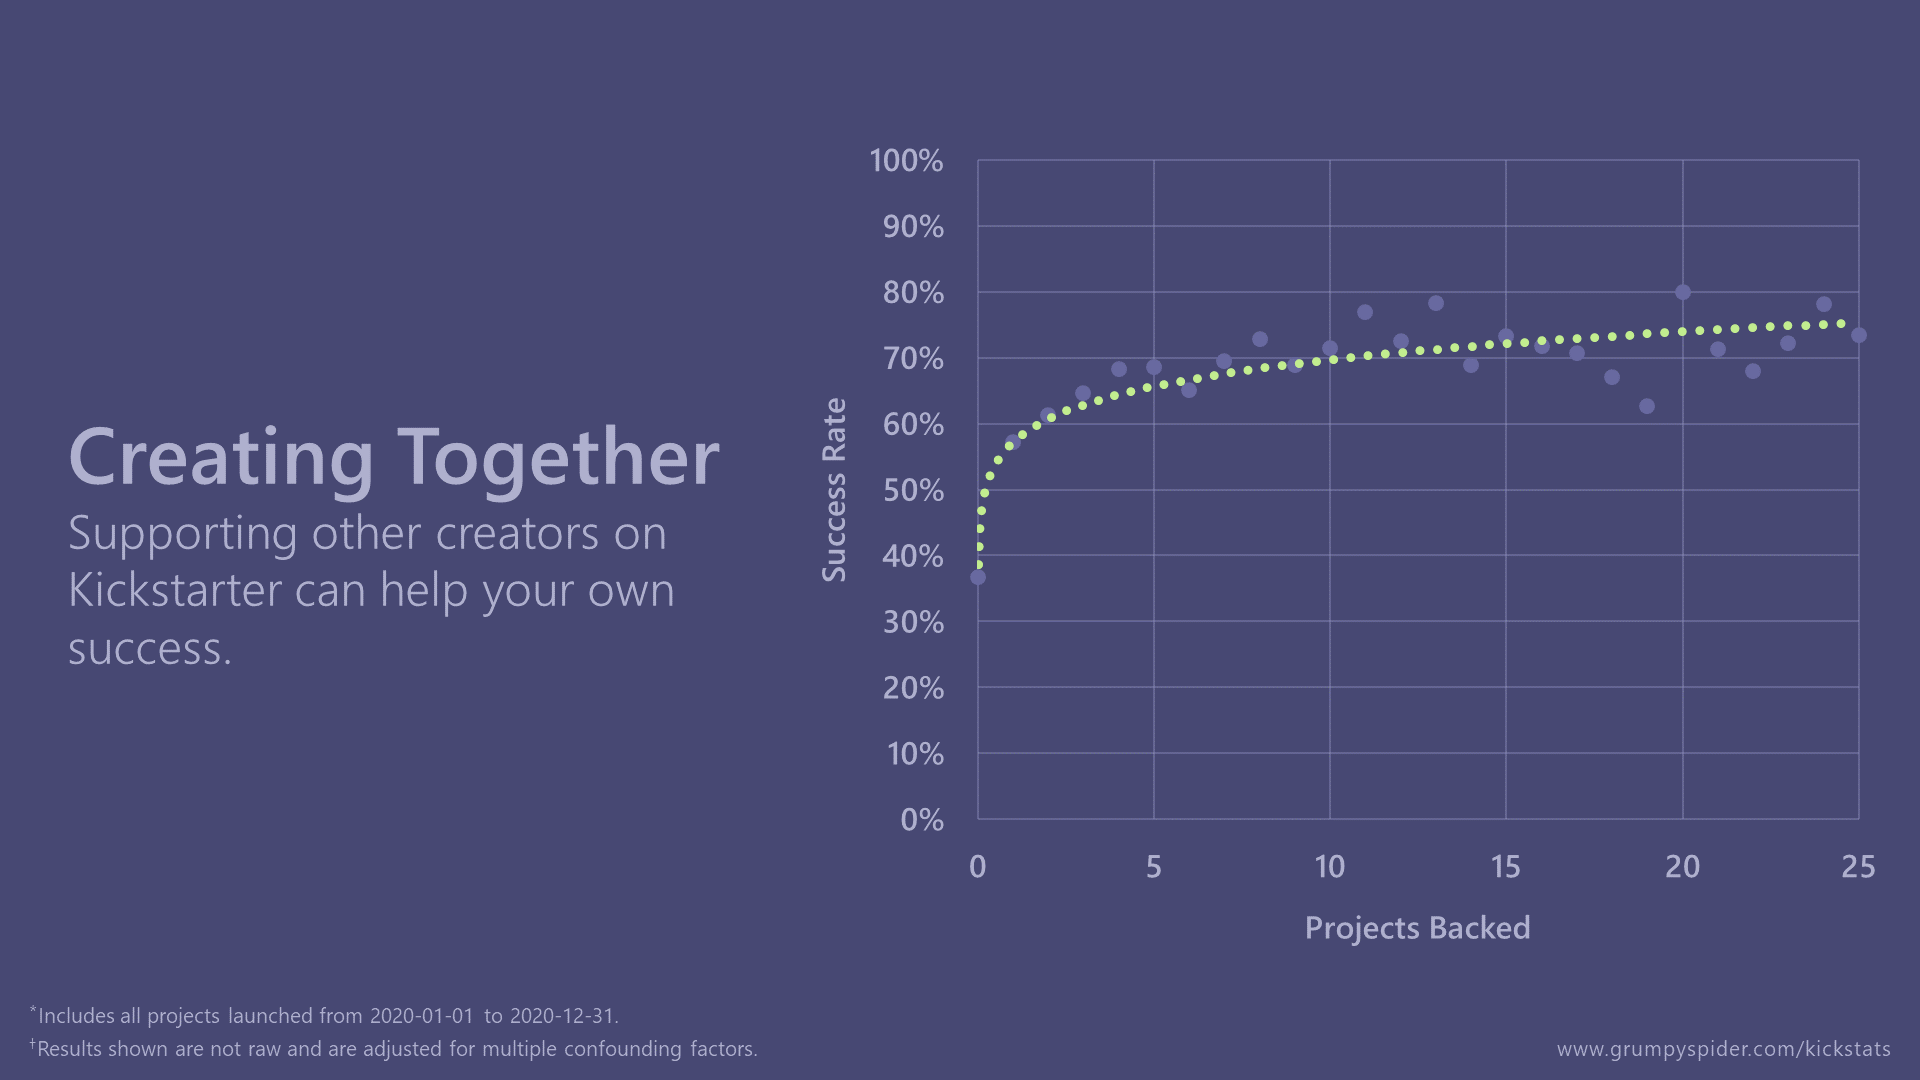
Remember when I predicted that the effects would taper off after four projects? Turns out I wasn’t terribly far off. Success rates jump a full 20 points from zero to one projects backed! From there, they continue to go up, but by increasingly lower amounts until around five projects or so. After that, any gains seen start to become pretty negligible.

On a side note, you may notice that this final graph doesn’t look much different from the first graph in this post. Most likely, that’s due to creator experience levels not really being a major confounding factor here, even though we had evidence to suggest that it was. But that’s okay; we didn’t know that beforehand, and in this case, adjusting for it doesn’t really harm the analysis.

Conclusion

Now, I’m not saying that backing projects somehow magically increases your Kickstarter’s chance of success. I don’t think that’s really what’s going on here. I believe what this analysis is really showing us is the power of putting others first. If all you do is show up on Kickstarter, never bothering to connect with anyone – to help them succeed in their endeavors – don’t be surprised to see your campaign never really take off itself.

I know that may sound harsh, but I really believe it’s the truth, and these numbers support that. So get out there, find a community to be involved in, and start creating together!

Kickstats: What’s the Best Campaign Length?

Photo by NeONBRAND on Unsplash

UPDATED 2021-03-17:

This article now includes all Kickstarter campaigns that launched in 2020. The significant increase in sample sizes has resulted in moderate changes to the outcome of our original analysis. Portions of this article have been rewritten to reflect those changes.

Kickstarter itself claims that campaigns lasting 30 days or less are more likely to succeed. I suppose that seems reasonable, but the original claim was made way back in 2011. A lot has changed since then, so I thought it would be best to take a look at it again and see what we come up with.

Arguments

On one hand, longer Kickstarter campaigns mean more time to fund. On the other, longer campaigns also reduce urgency by giving potential backers too much time to decide what they want to do, which may lead to them not backing at all.

Most people would say that reducing urgency has a much stronger effect on success, which means you should avoid longer campaigns. That certainly makes sense, but let’s see if the data supports it.

Analysis

To start, let’s create a simple chart showing Kickstarter project success rates by campaign length (the size of each point represents how many campaigns share that same length).

Chart showing Kickstarter success rates by campaign length.

At first glance, it looks just like what Kickstarter says: longer campaigns hurt your chances of success pretty much across the board. However, we know there may be some lurking variables that we need to account for.

First-Time Creators

We already know that first-time creators have lower success rates than their veteran counterparts. Why does that matter? Well, it may not – at least not on its own – but it could mean that there’s some confounding going on. To check for confounding, we need to show three things:

  • That campaign length is linked to success rates
  • That creator experience levels are linked to success rates
  • That campaign length and creator experience levels are correlated to each other

We’ve already shown the first two. If we can also show that campaign length and experience levels are related to each other, then we have a strong case for saying that they are confounding each other. So let’s graph the average campaign lengths of first-time creators vs veteran creators to see if there is any relationship.

Graph showing Kickstarter campaign lengths broken out by first-time vs veteran creators.

It’s no surprise that first-time creators have longer campaigns in general. They tend to have smaller audiences, and so it’s only natural to increase the length of their Kickstarter campaigns to help make up for that.

This link between creator experience levels and campaign lengths means that we can’t say for sure what’s going on. Do shorter campaigns do better because they’re shorter, or because they tend to be run by more experienced creators? Do longer campaigns do worse because they’re longer, or because they tend to be run by less experienced creators? At this point, we just don’t know.

So how do we separate the two? How do we determine the effect that a campaign’s length has on success without it accidentally being affected by a creator’s experience level as well? We use a little statistical analysis.

I won’t go into all the details here, but essentially, what we want to do is re-weight the data based on the concentration of given variables. In this case, there are comparatively fewer first-time creators with short campaigns. So, we’ll adjust those numbers to make it seem like there are as many with shorter campaigns as there are with longer ones. In this way, we help to remove the effect that experience has on success.

Results

After accounting for the different experience levels of Kickstarter creators, we come up with an interesting relationship between campaign length and success rates.

Chart showing Kickstarter campaign lengths vs success rates.

The negative trend is still there, but now, instead of it being clearly linear, it appears to be better explained with a curve. It seems that the higher success rate of very short campaigns – say, less than two weeks or so – is largely due to a heavy concentration of veteran creators. Once their effect was removed, we see that decreasing your campaign length isn’t always the best idea. At some point, making your campaign too short will begin to hurt you rather than help you.

I think this makes sense. Is it really reasonable to think that shortening your Kickstarter campaign will always help? If that were the case, why not make it one day long, and shoot your chances of success up to 90%?! No, what we see here is that you should shoot for the “sweet spot” – not so long that you remove urgency, but not so short that it’s finished before anyone even realizes it began.

So where is that sweet spot? Apparently somewhere around 2-4 weeks. And right in the middle of that is 21 days, which according to this analysis, is just about the best you can get.

UPDATE: There is now a strong case to be made for either a 17- or 24-day campaign. Why? because of the best day to launch and the best day to end a campaign.

Kickstats: The Problem of Causation

Photo by Evan Dennis on Unsplash

Did you know there’s a link between a population’s life expectancy and the average number of TVs per person? It’s true. You can increase your lifespan just by getting another TV!

Graph showing the life expectancy of different countries versus number of TVs per person

Now, if you have your wits about you, you may think that’s an absolutely ridiculous claim – and you’d be right! Of course buying another TV isn’t going to increase your lifespan. The reason more TVs correlates to longer life spans has nothing to do with TVs at all; it has everything to do with a particular lurking variable.

What are Lurking Variables?

Lurking variables are variables that influence your analysis, but aren’t accounted for in your study. They’re often hidden in the background and can even be completely unknown to the researcher – hence the name “lurking variable”.

In this example, the lurking variable is wealth. The more wealthy a population is, the more money it has to spend on TVs and healthcare.

That’s a silly example, I know, but it gets an important point across well. Correlation does not imply causation. Sometimes there are other factors at play that we’re just not aware of. This is one of the reasons why data analysis and statistics can be so tricky.

Kickstarter data is no exception. It’s common to hear people talk about what day of the week is best to launch a project, or how campaign length affects your chance of success, but it’s really important that we don’t assume causation too quickly. It’s only after a thoughtful analysis that accounts for many different factors that we can safely say there is true causation there.

And that’s what I plan to do with this Kickstats blog series. I want us to get as close as we can to finding out just what exactly causes a campaign’s chance of success to increase or decrease. And hopefully we’ll have some fun along the way!

Kickstats: First-time Creators

Photo by Leo Rivas on Unsplash

UPDATED 2021-03-09:

This article now includes all Kickstarter campaigns that launched in 2020. The significant increase in sample sizes has resulted in minor changes to the outcome of our original analysis. Portions of this article have been rewritten to reflect those changes.

Did you know that 66% of Kickstarter campaigns in 2020 came from first-time creators? With so many projects coming from newbies, it made me wonder how much a creator’s chance of success changes with the number of campaigns they’ve launched.

What’s my first-time chance of success on Kickstarter?

Well, that’s a difficult question to answer, since estimating chances of success for individual projects is an incredibly complex endeavor. I’d like to work up to a model that does that, but we’re not ready for that yet. For now, I can give you the overall success rate for creators who launched their very first campaign. This should at least give you an idea of what your campaign is up against.

Graph showing that only 39% of Kickstarter creators succeed on their first try.

To be honest, this actually isn’t all that surprising to me. If it’s true that Kickstarter’s success rate on the whole hovers around 51% or so, it makes sense that first-time creators would be significantly lower than that.

What this tells me is that there’s a pretty tough road ahead for creators. Success certainly isn’t guaranteed. So if your first campaign fails, just remember that you’re right there with the rest of the 61% of creators who failed their first time too.

But that leads right into the next question. What if my first project does fail?

What if my first Kickstarter campaign failed?

What if this isn’t your first Kickstarter campaign? Maybe it’s your second… and your first one failed. Will that stain your chance of success for this one? It seems like it would, but let’s take a look at the numbers.

Table showing Kickstarter success rates by number of previous campaigns versus number of previous successful campaigns.

I’m honestly surprised at how little of an effect failure has if it’s your first time. Take at look at “0 previous campaigns, 0 previous successes”, also known as “first-time creators”. Just like we said above, the chance of success is 39%. Now take a look at “1 previous campaign, 0 previous successes”. The success rate for that cohort drops by only one point! It’s really not until you’ve failed twice in a row that it starts to drag your chances down.

Conclusion

It’s true that failing will hurt the chances of success for your next campaign, but it’s not a crazy drop, and if you can get even one success behind you, you’ll be right back in the running. Kickstarter backers tend to be very forgiving when it comes to first-time creators. Most of them realize that it can be a steep learning curve and sometimes failure is your best teacher. If you get back up, learn from your mistakes, and try again, you just may be happy you did.

So what are your thoughts? Do you have any lessons learned from failed campaigns? What do you think has helped your successful campaigns the most? Let me know in the comments!

Kickstats: Category Popularity & Success

Photo by Jungwoo Hong on Unsplash

UPDATED 2021-03-04:
This article now includes all Kickstarter campaigns that launched in 2020. The significant increase in sample sizes has resulted in minor changes to the outcome of our original analysis. Portions of this article have been rewritten to reflect those changes.

It often takes a lot of data to properly analyze complex issues, and Kickstarter is no exception! But while we wait for the data to slowly pour in, I thought it would be interesting to look at the different categories Kickstarter has to offer, and how they make up the whole.

Kickstarter Categories

Kickstarter has 15 parent categories for different projects, and those parent categories break down into even more standard categories. Here’s a quick look at the top 10 based on percentage of total projects launched from January through December 2020.

Chart showing most popular categories on Kickstarter

That’s pretty cool, but we’re probably more interested in what categories have the highest success rates:

Chart showing most successful categories on Kickstarter

And Anthology Comics takes the gold, at an impressive 85.7% success rate! Board games – the largest category – is still pretty impressive though, at 71.8%, which is good to know as Grumpy Spider works toward launching our first game.

But all this got me curious – what if we looked at popularity of a category vs success? I wonder what that would look like. Thus, I present this hub & spoke chart of Kickstarter’s category hierarchies showing popularity vs success rates!

Chart showing popularity and success rates of Kickstarter categories

The lines show category hierarchies, the size represents the percentage of total projects that are from that category, and the brightness shows the success rate of that category. Also, in order to get a dedicated node, a category had to make up at least 7% of its parent node. Otherwise, they were lumped into their respective “Other” buckets.

The success rate of Kickstarter overall in 2020 was just over 51%, but individual categories can differ quite a bit from that, obviously. Just look at poor Technology… a relatively popular category, but really low success rates overall. I almost feel bad for Apps, which takes last place, at a measly 7% success rate.

Meanwhile, Comics seems to do the best overall, with several of their categories doing unusually well.

Conclusion

I can’t say that I have many conclusions to draw – I just thought it was interesting. But there is one important thing to keep in mind as we move forward in this series…

Be careful not to take general information and assume it always applies to specific cases. For instance, Tabletop Games as a category has a 72% success rate. Does that mean that your next tabletop campaign has a 72% chance of success? Absolutely not! Individual cases are much too complex for such simple predictions – that’s why we need lots of data, and solid methods of statistical analysis to help us find what really helps or hurts the average campaign. And that’s just what this series is all about!

Kickstats: The Biggest Factor

Photo by Elena Koycheva on Unsplash

If you’re like me, you’re anticipation is growing uncontrollably as you approach your Kickstarter launch! At this point, you may have started wondering what tweaks you can make to give your campaign just a little bit more of an edge. Well, that’s what this series is all about! I plan to use data from literally thousands of Kickstarter projects to find out what changes you can make to your campaign that will maximize your chance of success.

But before we dive in to all that data goodness, there’s an important point that I need stress as much as possible.

There are no shortcuts. The biggest factor to your Kickstarter’s success is the quality of your product and campaign page.

I know it may seem obvious, but it’s incredibly important to understand that the biggest factor to your success is the quality of your product and the quality of your campaign page. Preparing for and running a Kickstarter campaign takes a lot of effort, and the questions I plan to address in this blog series should not be viewed as shortcuts – because they aren’t. No amount of launching at the right time, having the right number of pledge tiers, or having the ideal campaign length will save a project that doesn’t have the necessary effort to back it up.

Every blog entry that I write from here on out will be based on this one idea. We will always start with the assumption that you have a good idea, and that you’ve put in a reasonable amount of effort toward its success. Now, I do have plans to cover a few things you can do to improve the quality of your campaign page overall, but most aspects of a page are just too difficult for me to quantify.

On a more upbeat note though, I don’t think that assumption is a very difficult one to make. The fact that you’re even reading this blog suggests you’re willing to put in the effort to help your campaign succeed.

Kickstats: Introduction

Photo by Gia Oris on Unsplash

We all want our Kickstarter campaigns to do well, right? So it’s only natural for us to wonder about things like:

as well as a host of other questions.

Well, now that Grumpy Spider Games is getting ready for its first Kickstarter launch, Rucksack, I found myself asking those same questions. But the more I looked, the more disappointed I became.

I was able to find some answers, but they often weren’t quite as helpful as I had hoped. Many were based on anecdotal evidence, or just what seemed reasonable to the person answering the question. I found very few answers that were based on real numbers, and when they were, there were other aspects that limited their usefulness.

I was just about to resign myself to the dark reality of a data-less world when I came to a sudden realization. I am a statistician – as in, my day job is all about collecting, cleaning, and analyzing data. If I couldn’t find the answers I was looking for, why wasn’t I answering them myself? I mean, Kickstarter is a treasure trove of information just waiting to be mined!

So with that, I’ve decided to start “Kickstats“, a series of blog posts dedicated to answering data-centric questions about what affects the average campaign’s success rate.

What questions do you have?

I’ve got several questions that I personally want answered, but I’m sure I haven’t thought of everything. So, if you have any questions that you’re curious about, let me know in the comments, and I’ll see if I can feature them in a future post!